
Every country measures housing affordability differently, and almost all of them measure it the same wrong way: the ratio of house prices to incomes. That ratio ignores the price of money. In 2026 a Spanish buyer borrows at 2.85% and an American at 6.58% — on identical price-to-income ratios, those are not remotely the same burden.
So we asked a different question, the one a lender actually asks: what does a household have to earn to qualify for a mortgage on a typical home at today's interest rate?
Source: CalculatorAI · calculatorai.app
We ran it on official statistics from six countries — the United States, France, Spain, Portugal, Japan and China — using our own mortgage engine, the same one behind the site's mortgage calculator. Every input comes from the country's own statistical authority. No listing portals, no crowd-sourced price sites. The full dataset is downloadable.
The headline: the same 70 m² flat, everywhere
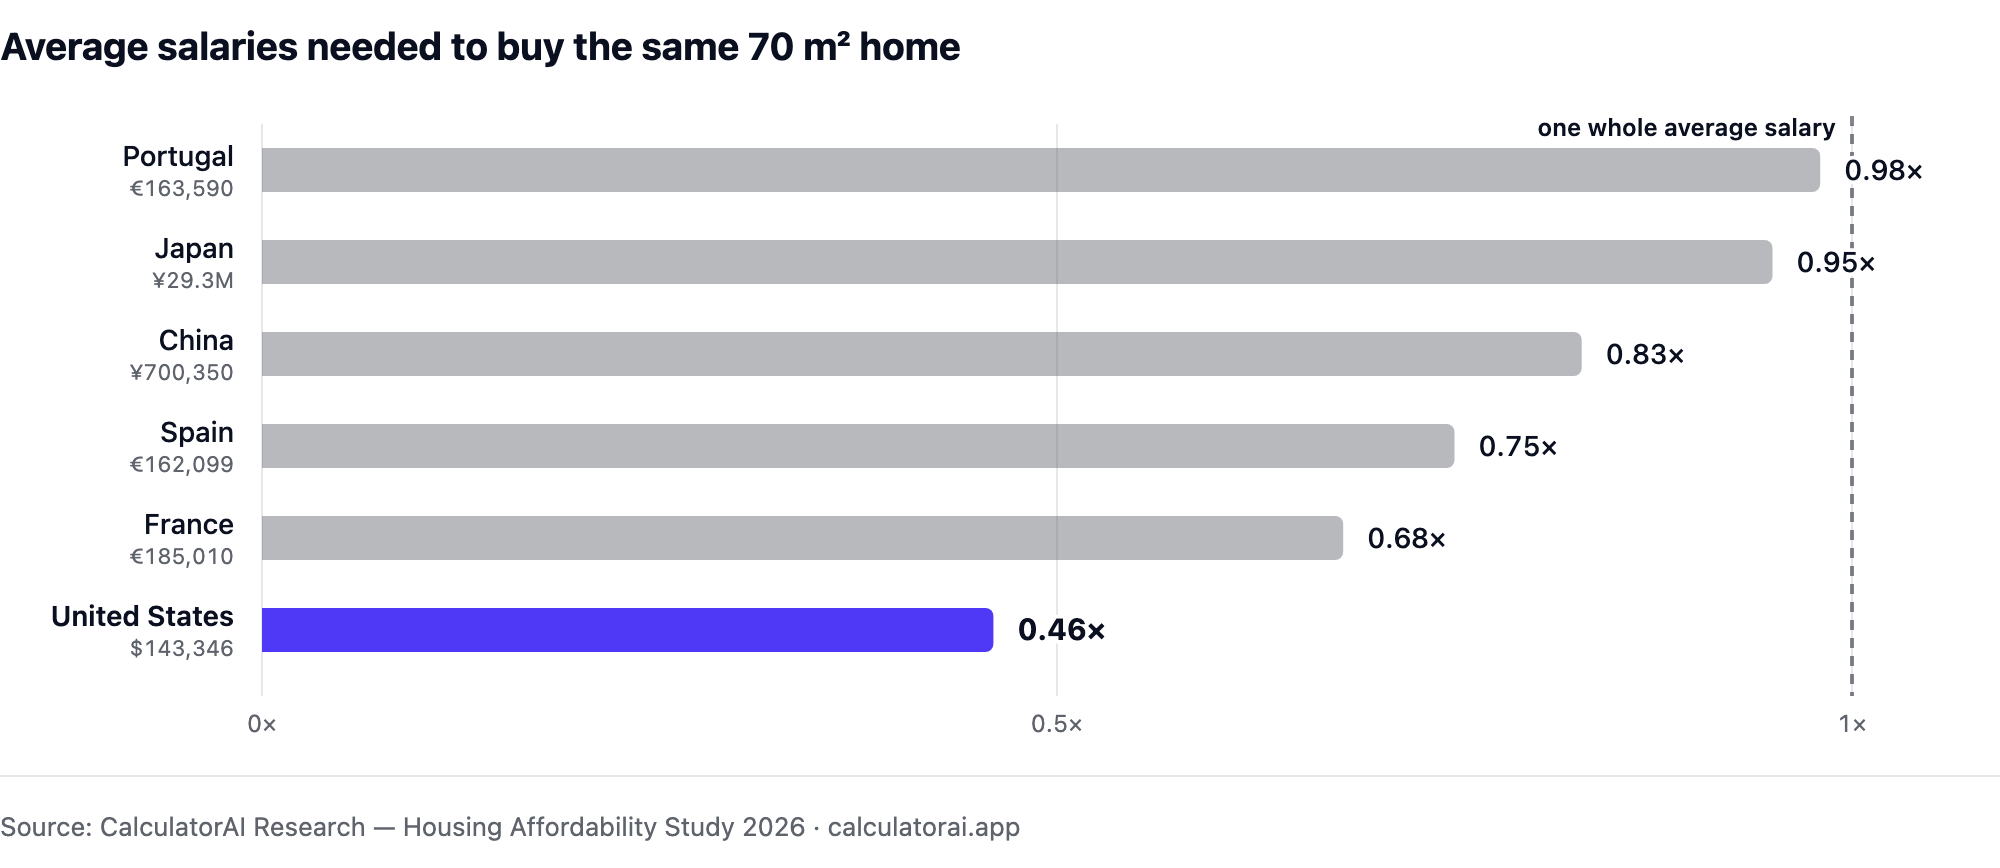
To compare countries you have to hold the home constant. This is the price of the identical 70 m² dwelling in each country, financed with 20% down over 25 years, with the mortgage payment capped at 30% of gross income.
The United States sits at the bottom of this chart with double everyone else’s interest rate. That is the finding, not an error — and the next chart shows why.
Show these figures as a table
| Value (×) | |
|---|---|
| Portugal — €163,590 | 0.98 |
| Japan — ¥29.3M | 0.95 |
| China — ¥700,350 | 0.83 |
| Spain — €162,099 | 0.75 |
| France — €185,010 | 0.68 |
| United States — $143,346 | 0.46 |
Source: CalculatorAI · calculatorai.app · Sources: NAR / US Census / BLS / Freddie Mac · DGFiP DVF / Eurostat / ECB · Ministerio de Vivienda · INE Portugal · Japan Housing Finance Agency / NTA · China NBS / PBoC. Full table and methodology below.

| Country | Salaries needed | Home (70 m²) | Rate | Payment / mo | Income needed | Average wage |
|---|---|---|---|---|---|---|
| Portugal | 0.98 | €163,590 | 2.91% | €615 | €24,580 | €25,187 |
| Japan | 0.95 | ¥29.3M | 3.14% | ¥112,994 | ¥4,519,756 | ¥4,780,000 |
| China | 0.83 | ¥700,350 | 3.10% | ¥2,686 | ¥107,446 | ¥129,441 |
| Spain | 0.75 | €162,099 | 2.85% | €605 | €24,195 | €32,446 |
| France | 0.68 | €185,010 | 3.10% | €710 | €28,384 | €41,764 |
| United States | 0.46 | $143,346 | 6.58% | $780 | $31,202 | $67,134 |
Source: CalculatorAI · calculatorai.app
Portugal is the hardest place in this study to buy a flat — and not because Portuguese property is expensive. At €2,337/m² it is barely dearer than Spain's €2,315/m². The difference is the wage: the average Portuguese salary is 22% below the Spanish one, so the same flat swallows a whole salary instead of three quarters of one. Portugal also recorded the largest annual house-price increase in the European Union in the first quarter of 2026.
The twist: America has the cheapest square metre here
The United States sits at the bottom of that table — the most affordable of the six — with the highest interest rate in the study by a factor of two. That is not a mistake, and it is the most interesting thing we found.
American housing is cheap per unit of space. The median new single-family house sold in 2025 went for $417,400 and measured 2,194 square feet — about 204 m², or $2,048 per square metre. That is less than Spain, less than Portugal, less than France. On a like-for-like 70 m² flat, even at 6.58%, an American needs less than half an average salary.
Then Americans buy 204 m² of it.
The United States has the longest line in the chart. Americans buy 204 m² where the French buy 74 — which is why the country with the cheapest square metre still ends up with one of the heaviest housing burdens.
Show these figures as a table
| Same 70 m² flat (×) | Their own typical home (×) | |
|---|---|---|
| United States | 0.46 | 1.35 |
| Japan | 0.95 | 1.35 |
| France | 0.68 | 0.66 |
Source: CalculatorAI · calculatorai.app
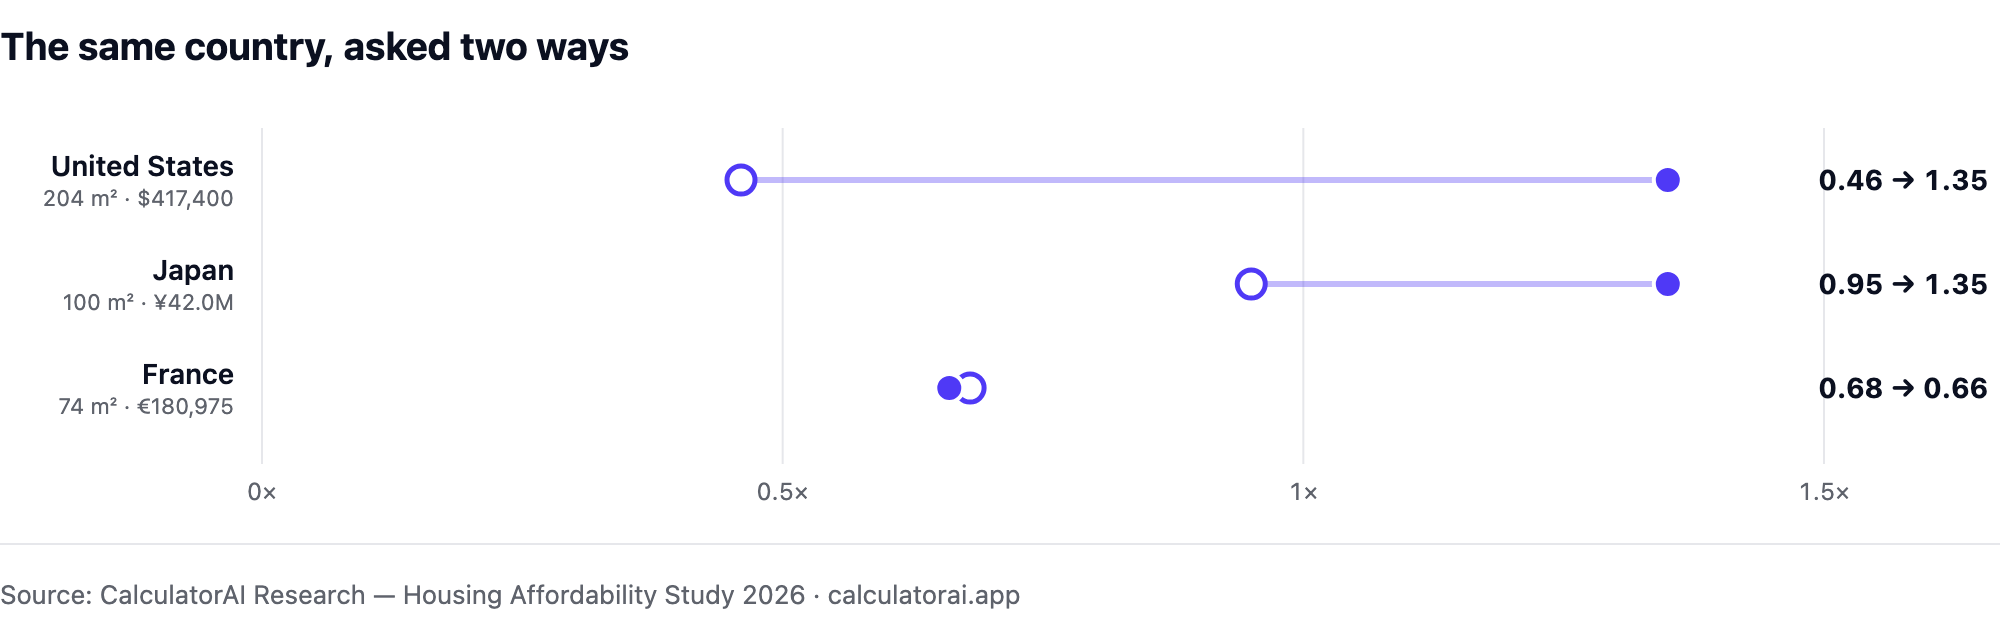

Hold the home constant and the US is the most affordable market in the study. Let each country buy its own typical home and the US needs 1.35 average salaries — tied with Japan for the heaviest burden of the six.
Both numbers are true, and together they say something a price-to-income ratio never can: Americans do not have a price-per-square-metre problem. They have a size-and-rate problem. Those are two separate levers — one is what gets built and bought, the other is monetary policy — and lumping them into a single affordability ratio hides both.
France is the control case that shows the effect is real: the median French dwelling is 74 m², so close to our 70 m² standard that both ways of asking the question give nearly the same answer, 0.68 and 0.66.
Does the model actually match reality?
This is where most affordability studies quietly stop. We can check ours, because Japan publishes what its borrowers really pay.
The Japan Housing Finance Agency surveys every Flat 35 borrower. In its FY2025 results, released on 24 July 2026, the average borrower bought a 100.3 m² home for ¥42.0 million and pays ¥123,800 a month.
Run our engine on Japan's own norms — its 35-year term, its 3.14% fixed rate, that same home — and it produces ¥132,040 a month. That is within 6% of what an entire country of borrowers actually signed, with the remainder explained by the many Japanese buyers on variable rates below the fixed one.
Why one number per country is never enough
Two countries in this study publish figures that change the answer depending on which official number you take, and both deserve to be stated rather than smoothed over.
China publishes two average wages. The urban non-private figure — ¥129,441 — is the one usually quoted as "the average Chinese wage". The urban private-sector average, where most people actually work, is ¥71,590, some 45% lower. Against the first, a 70 m² flat needs 0.83 salaries. Against the second, 1.50. Same flat, same rate, same country.
Japan and the US both have national mortgage norms that differ from our 25-year convention. At Japan's 35 years the figure falls from 0.95 to 0.77; at the American 30 years, from 0.46 to 0.44. We hold the term constant across countries for comparability and report the national norms alongside, rather than picking whichever produces a better headline.
Method, in full
Fixed before the data was collected, so the result could not be steered:
- Home: the national median or average dwelling from each country's own official statistics. Where only a price per square metre is published, a 70 m² dwelling — the convention the Deloitte Property Index uses, so these figures can be checked against a known benchmark.
- Deposit: 20% everywhere. Term: 25 years everywhere. Threshold: the mortgage payment must fit within 30% of gross income.
- Rate: the current average rate on new housing loans, from the central bank or its national equivalent.
- Income: average gross annual earnings of one full-time worker, per country. Averages sit above medians, so every figure here is conservative — the typical household is worse off than this study says.
- Payment: principal and interest only. Property taxes, insurance and service charges have no comparable cross-country series, and including them for some countries but not others would break the comparison.
Fixed before collection
Identical rules for all six countries
- Home
- 70 m²
- Same dwelling benchmark
- Deposit
- 20%
- Of the home price
- Term
- 25 years
- Same amortisation period
- Payment cap
- 30%
- Of gross monthly income
Official country inputs
Observed, never estimated by CalculatorAI
- Price
- National dwelling price
- Statistical authority or transaction register
- Rate
- New housing-loan rate
- Central bank or national equivalent
- Income
- Average gross earnings
- One full-time worker
Common calculation
The same mortgage engine for every row
Why this is comparable: only official country data changes; the home benchmark, deposit, term, payment cap and calculation stay fixed.
Data sources
Every figure below is from a national statistical authority or central bank. No listing portals, no crowd-sourced price sites. Links go to the specific publication used, not to a homepage. All accessed 28 July 2026.
| Figure | Publication | Authority |
|---|---|---|
| US median existing-home price | Existing-Home Sales, June 2026 | National Association of Realtors |
| US new-home price + floor area | Characteristics of New Housing, 2025 | US Census Bureau |
| US mortgage rate | 30-Year Fixed Rate Mortgage Average, MORTGAGE30US | Freddie Mac PMMS via FRED |
| US average earnings | Average Weekly Earnings, Total Private, CES0500000011 | US Bureau of Labor Statistics via FRED |
| French dwelling prices | Demandes de valeurs foncières, full-year 2025 | DGFiP (French tax authority) |
| Euro-area mortgage rates | MIR — Cost of borrowing for house purchase, new business | European Central Bank |
| FR / ES / PT earnings | Annual net earnings, earn_nt_net | Eurostat |
| Spanish house prices | Precio medio del m² de vivienda libre, Q1 2026 | Ministerio de Vivienda y Agenda Urbana |
| Portuguese house prices | Estatísticas de Preços da Habitação ao Nível Local, Q1 2026 | INE Portugal |
| Japanese prices, floor area, payments | Flat 35 User Survey, FY2025 | Japan Housing Finance Agency |
| Japanese average salary | 民間給与実態統計調査, FY2024 | National Tax Agency |
| Chinese house prices | 2025 national real-estate market situation | National Bureau of Statistics |
| Chinese wages | 2025 average wage of urban employed persons | National Bureau of Statistics |
| Chinese mortgage rate | Monetary Policy Report Q1 2026 | People's Bank of China |
Every figure above runs through the same engine as the site's public mortgage calculator — you can reproduce any row by entering that country's price, rate and a 20% deposit over 25 years. The French median was recomputed from the raw DGFiP register rather than taken from a published summary. Download the full dataset as CSV, including the inputs, the intermediate payment figures and the sources column.
Republishing: the two charts above can be downloaded as PNG or SVG, and each has its own link — the 70 m² comparison and the typical-home comparison — so you can point readers at a single figure rather than the whole article. Attribution requested: CalculatorAI Research — Housing Affordability Study 2026.
Sources, by country: United States — NAR existing-home price, US Census new-home price and floor area, BLS earnings, Freddie Mac PMMS rate. France — the national median recomputed from DGFiP's Demandes de valeurs foncières register (746,163 individual recorded sales in 2025), Eurostat earnings, ECB rate. Spain — Ministerio de Vivienda, Eurostat, ECB. Portugal — INE, Eurostat, ECB. Japan — Japan Housing Finance Agency Flat 35 survey, National Tax Agency earnings. China — National Bureau of Statistics prices and wages, People's Bank of China rate.
What we are not claiming. France excludes Alsace-Moselle and Mayotte, which keep a separate land register. China's price covers newly built housing only, not resale. Japan's price describes Flat 35 borrowers, who by definition could afford to buy. The US per-square-metre figure pairs price and floor area from the same Census universe of new single-family homes; the $440,600 median existing-home price from NAR is a different universe and is not mixed with it.
We began this study intending to cover ten countries. Four were dropped — Germany and Italy publish no current national price level we could source directly, Turkey's official per-square-metre series sits behind a registration wall, and Russia's statistical agencies were unreachable. Publishing six countries we can stand behind beats ten where four rows are shaky.
Run it on your own numbers
The table above is a national average, and nobody lives in a national average. If you want the figure for the home you are actually looking at, the mortgage calculator takes your price, deposit, rate and term; the rent vs buy calculator answers the question that comes right after it.
Frequently asked questions
Which country needs the highest salary to buy a home? Of the six studied, Portugal — 0.98 average salaries for a 70 m² flat. If you compare the home each country actually buys rather than a fixed flat, the United States and Japan are joint highest at 1.35.
Why does the US look affordable despite 6.58% mortgage rates? Because American housing is cheap per square metre — about $2,048/m², below Spain, Portugal and France. The high rate and the large typical home (204 m²) are what make the American burden heavy, not the price of space itself.
What income do you need to buy a median US home? On the median new single-family house sold in 2025 ($417,400), with 20% down over 25 years at 6.58%, and the payment capped at 30% of gross income, about $90,700 a year — roughly 1.35 times the average American wage.
Is this the same as a price-to-income ratio? No. A price-to-income ratio ignores interest rates entirely. This study asks what income a lender would require at today's rate, which is why two countries with similar price-to-income ratios can land far apart here.
Can I see the underlying data? Yes — the full dataset is available as a CSV, with every figure, its source and its date.