Trading Consistency Score: What Prop Firms Measure and How to Improve It
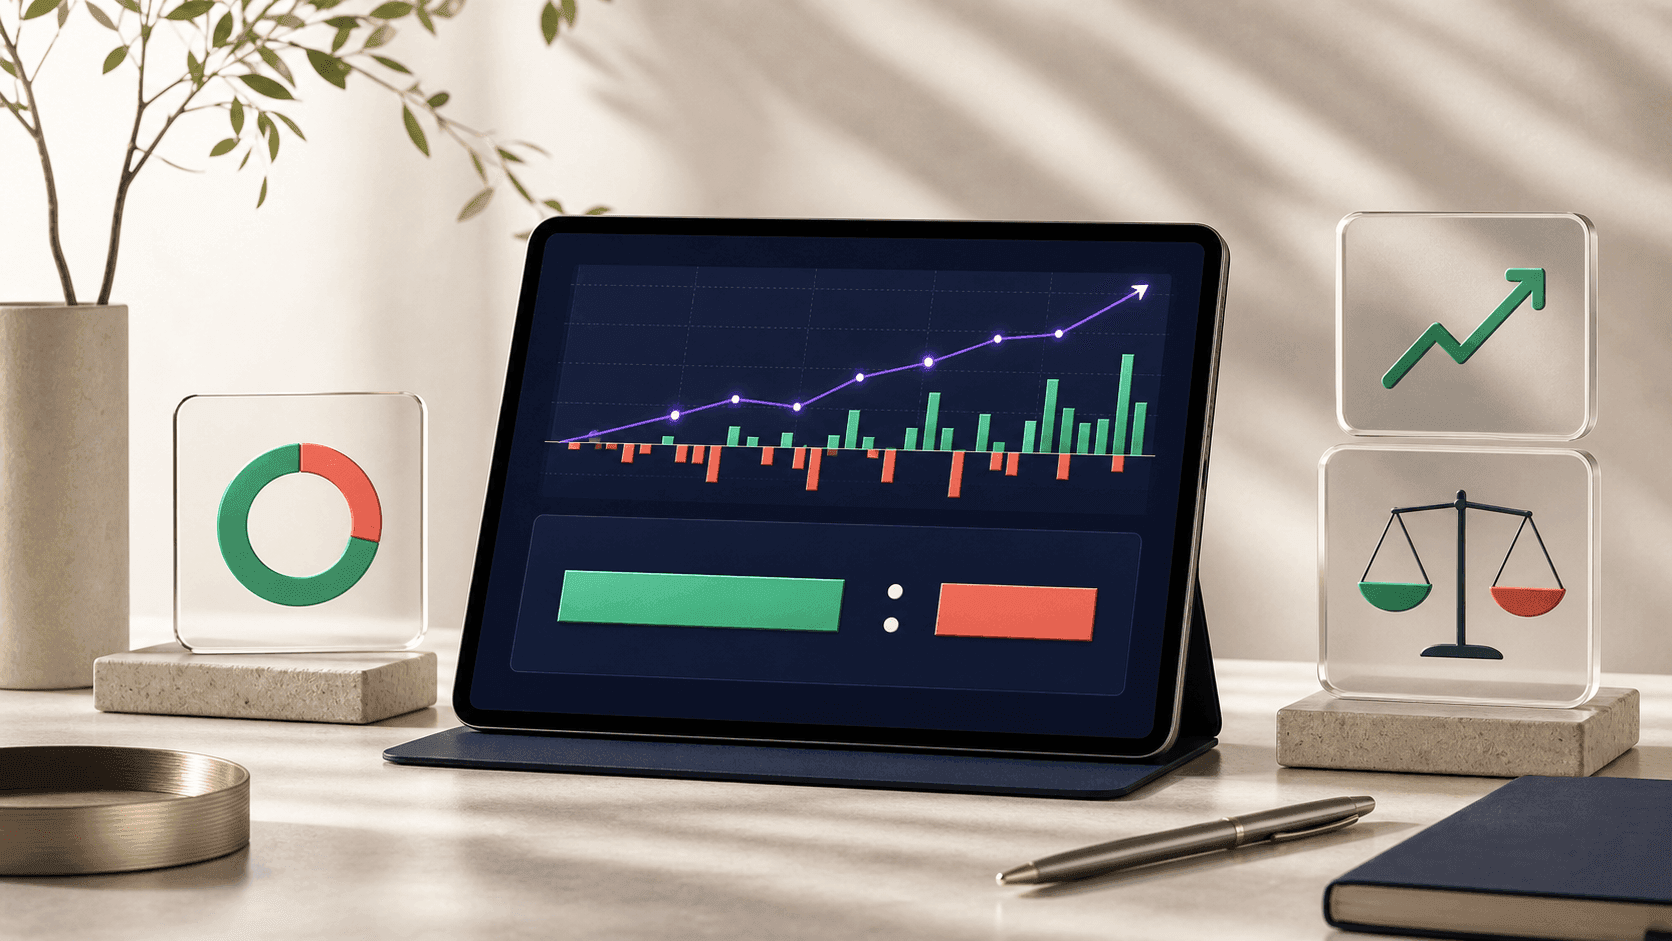
Topstep, FTMO, Apex and Take Profit Trader cap how much of your profit one day may carry. See each rule, the math of a $1,400 day and how to fix the ratio.
Usamos cookies para mantener tu sesión iniciada. Política de cookies
Usamos cookies
CalculatorAI utiliza cookies para mantener su sesión iniciada y recordar sus preferencias. Las cookies opcionales nos ayudan a comprender cómo se utiliza el sitio. Política de cookies
Trade with discipline, not hope — how to keep a trading journal, and the win-rate, risk-reward and expectancy math that decides if a system is profitable.
Tools these guides use

Topstep, FTMO, Apex and Take Profit Trader cap how much of your profit one day may carry. See each rule, the math of a $1,400 day and how to fix the ratio.

Revenge trading leaves four fingerprints in a trade log: time, size, pace and broken rules. See what chasing losses does to a winning strategy over a year.

A 97% win rate can still lose money. How copy trading leaderboards hide rare big losses, what copying costs you, and the five numbers to check before you copy.

Bitcoin rose in 10 of 13 Octobers since 2013, averaging +19.9%. See every year, the dips inside the month, and what 10x or 20x leverage did to long trades.

Risk of ruin is the chance a losing streak takes your account past the point of no return. See the odds at 0.5% to 10% risk per trade, with streaks and Kelly.

Profit factor is gross profit ÷ gross loss. See why 1.5 can hide 12-loss streaks, how costs shrink it and why 50 trades can't tell a 1.0 edge from 2.0.

Test an AI trading bot with net expectancy, live fills, drawdown and costs—not win rate. Includes five bot profiles and a 10,000-run stress test.

Size 0DTE options from defined maximum loss, not a hopeful stop. See contract counts, daily limits and a worked $25,000 account example.

Turn NinjaTrader’s Trade Performance report into a useful futures journal with net P&L, expectancy, MAE, MFE, rule adherence and session review.

Where MT5 keeps your history, how to export it (Report → Open XML or HTML), what the built-in report computes and misses, and how to import it into a journal.

Set up TradingView's simulator like a funded account, price the commissions and slippage it skips, and journal fifty paper trades so they prove something.

Footprint, DOM heatmap, CVD and liquidation maps: what three order-flow platforms cover, what a year costs on each plan, and which fits a crypto trader.

One trader, 20,000 challenge attempts, seven risk sizes: where the chance of getting funded peaks, why the daily-loss rule closes most accounts, how to size.

Static vs trailing prop-firm drawdown on one week of trades: where the floor sits under each rule, how much room is left, and how to size to the rule you have.

TraderSync, Tradervue, Edgewonk and CalculatorAI compared on price, imports, analytics and psychology tools—plus who each journal fits best.

Topstep’s $50K Combine has a $2,000 trailing loss limit and a 55% consistency target. See the real risk budget, formulas and journal fields.

FTMO’s 1-Step and 2-Step rules look simple until floating losses and midnight resets collide. Here is the real risk budget on a $100K challenge.

A genuinely profitable strategy still spends 68 trades under water and loses money in a third of its 40-trade windows. Simulated numbers for a normal drawdown.

Turn TradingView charts, alerts and Bar Replay into a repeatable pre-trade routine—with risk math and a journal that preserves every decision.

Most blown accounts are a sizing problem, not a strategy problem. The 1% rule, the position size formula, and worked examples for stocks, forex and crypto.

You can win 40% of trades and still be profitable. Learn how win rate, risk-reward and expectancy combine — and how to compute yours.

A trading journal is the fastest way to stop repeating losing trades. Learn exactly what to log, the metrics that matter, and how to review it.