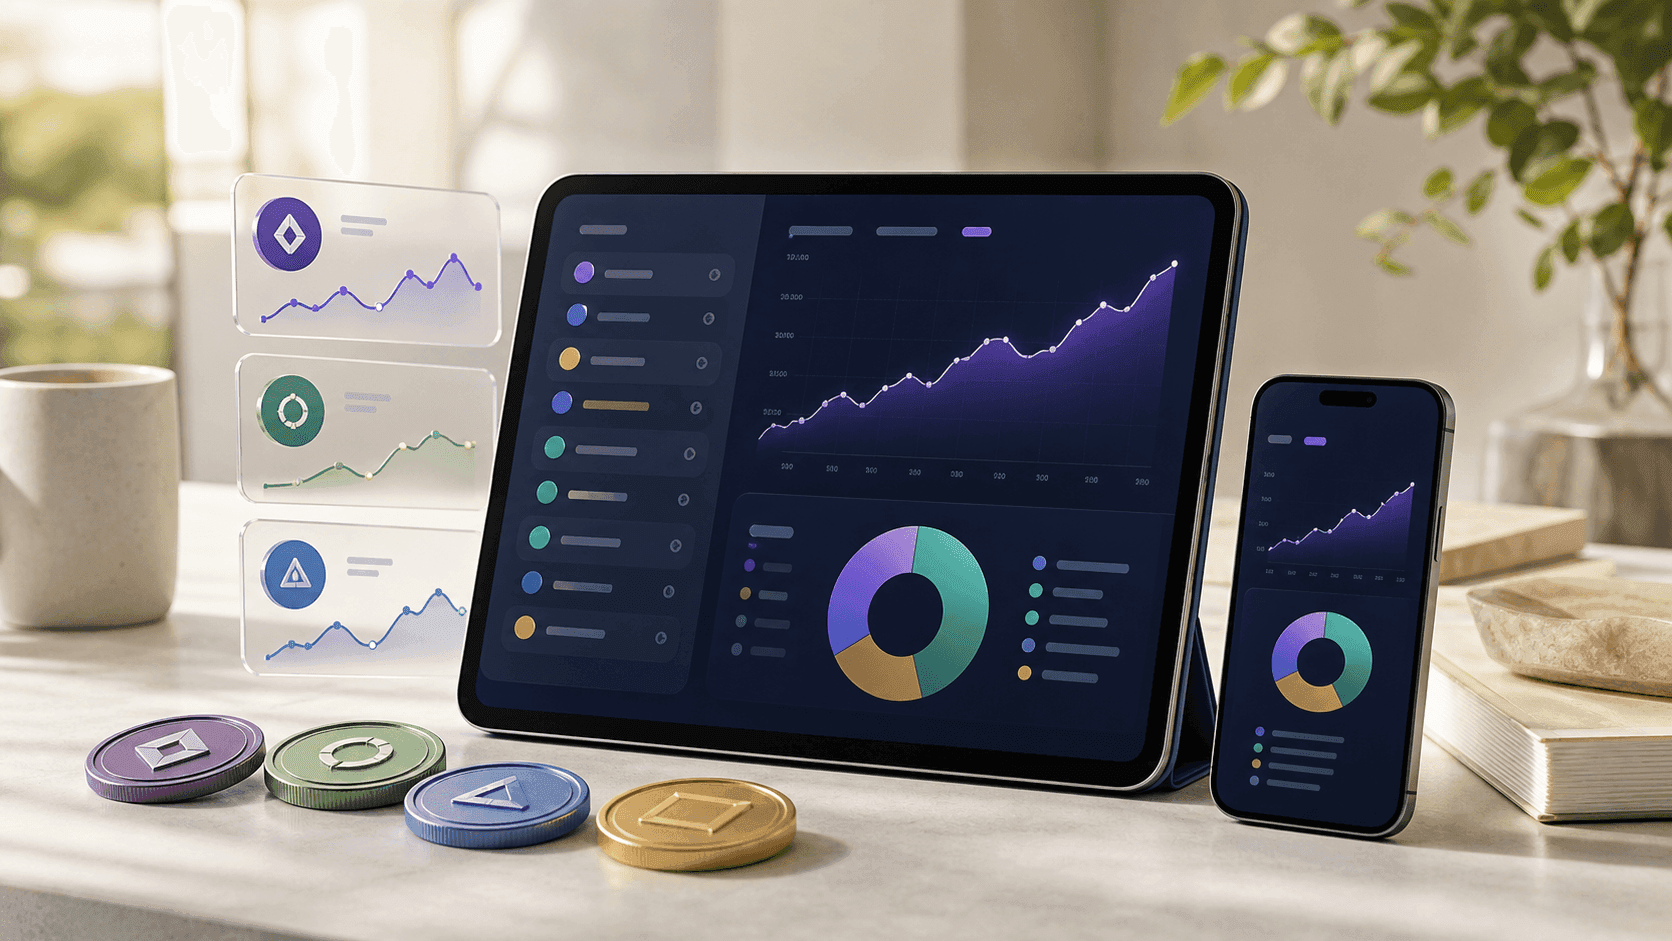
If someone asked what your investments returned last year — not the S&P, yours, after every buy, sell and dividend — could you answer within 5%? Most investors cannot. They know what their biggest holding did and roughly what the account balance is, but the real number, the blended return of everything they own, is a mystery. Tracking your portfolio properly fixes that, and it takes less maintenance than most people fear.
This guide covers what to track, why cost basis is the number everyone gets wrong, and a low-effort system that keeps it current without a fragile spreadsheet.
What tracking your portfolio actually means
It is four questions, answered continuously:
- What do I own, and what is it worth right now? Holdings times live prices.
- What did it cost me? Your cost basis — the real, fee- and dividend-adjusted amount you put in.
- How am I doing? Unrealized and realized gains, and your blended return.
- How is it built? Allocation across assets, sectors and accounts — your actual risk, not the one you imagine.
A balance in a brokerage app answers only the first, and only for that one account. The other three are where the decisions live.
Cost basis: the number everyone gets wrong
Your return is only as accurate as your cost basis, and cost basis is deceptively hard once you have done anything other than a single lump-sum buy:
- Multiple buys at different prices give you an average cost per share — not the price of your last purchase.
- Reinvested dividends are new purchases and raise your basis; ignoring them understates it.
- Fees and commissions are part of what you paid.
- Selling part of a position forces a choice of which shares you sold (FIFO, average, specific lots), and it changes the basis of what remains.
Get this wrong and every performance number downstream is wrong too. The Average Buy Price Calculator handles the common case — several buys at different prices — and gives you the true blended cost per share to record.
Price return vs. total return
The number most people quote is price return — what the share price did. The number that matters is total return, which adds dividends and interest. For a dividend-paying portfolio the gap is not small: reinvested dividends can be a large share of long-run returns. Always track total return, or you will systematically understate how you are doing and undervalue income-producing holdings.
A low-maintenance system
You do not need to touch this daily. A system that survives real life:
- Record each holding once — ticker, shares, and your true average cost (fees and reinvestments included).
- Log transactions as they happen — a buy, a sell, a dividend. Two minutes at the moment beats reconstructing a year in April.
- Let prices update themselves. Manually refreshing quotes is the step everyone abandons. Use a tracker that pulls live prices so your value and gains are current without effort.
- Review monthly, not hourly. Check allocation drift and total return once a month. Daily checking changes nothing but your blood pressure.
Watch your allocation, not just your balance
A rising balance can hide rising risk. If one winner has grown to 40% of the portfolio, your return is now that one stock's story — great on the way up, brutal on the way down. Tracking allocation is how you catch concentration before the market does. (We go deep on this in our guide to portfolio diversification.) At minimum, know your split across your largest positions, across asset types (stocks, bonds, cash, crypto), and across accounts, and rebalance when something drifts far from your target.
Spreadsheet vs. a real tracker
A spreadsheet can do all of this, and for a few holdings it is fine. It breaks down on the two things it cannot do itself: pulling live prices, and getting cost basis right across partial sells and reinvested dividends. That is where a purpose-built tool earns its keep. The free Portfolio Tracker records your holdings and transactions, pulls live stock and crypto prices, and shows current value, cost basis, realized and unrealized gains, and your allocation across sectors and accounts — no formulas to maintain and nothing to break when you paste a new row. Import a wallet or exchange to skip the manual entry entirely.
Frequently asked questions
How do I track my investment portfolio for free? Record each holding with its share count and true average cost, log buys, sells and dividends as they happen, and use a tool that pulls live prices so the value and gains stay current. The free Portfolio Tracker does this across stocks and crypto without a spreadsheet.
What is cost basis and why does it matter? Cost basis is the total, fee- and dividend-adjusted amount you actually paid for a holding. Every performance and tax number depends on it. With multiple buys it is your average cost per share, not the price of your most recent purchase — the Average Buy Price Calculator works it out.
What is the difference between price return and total return? Price return counts only the change in share price. Total return adds dividends and interest, and it is the honest figure — especially for dividend-paying portfolios, where reinvested dividends drive a large part of long-run growth.
How often should I check my portfolio? For a long-term portfolio, a monthly review of allocation and total return is plenty. Daily checking tends to trigger emotional decisions without adding information.
Do I need a portfolio tracker if my broker shows my balance? A broker shows one account's balance and price return. A tracker consolidates every account, gets cost basis right across partial sells and reinvestments, adds dividends for true total return, and shows your real allocation and risk. That is the difference between a number and a picture.
See your real numbers
Add your holdings to the free Portfolio Tracker, let it pull live prices, and get your true value, gains and allocation in one view. Fix your cost basis first with the Average Buy Price Calculator and everything downstream will finally be accurate.