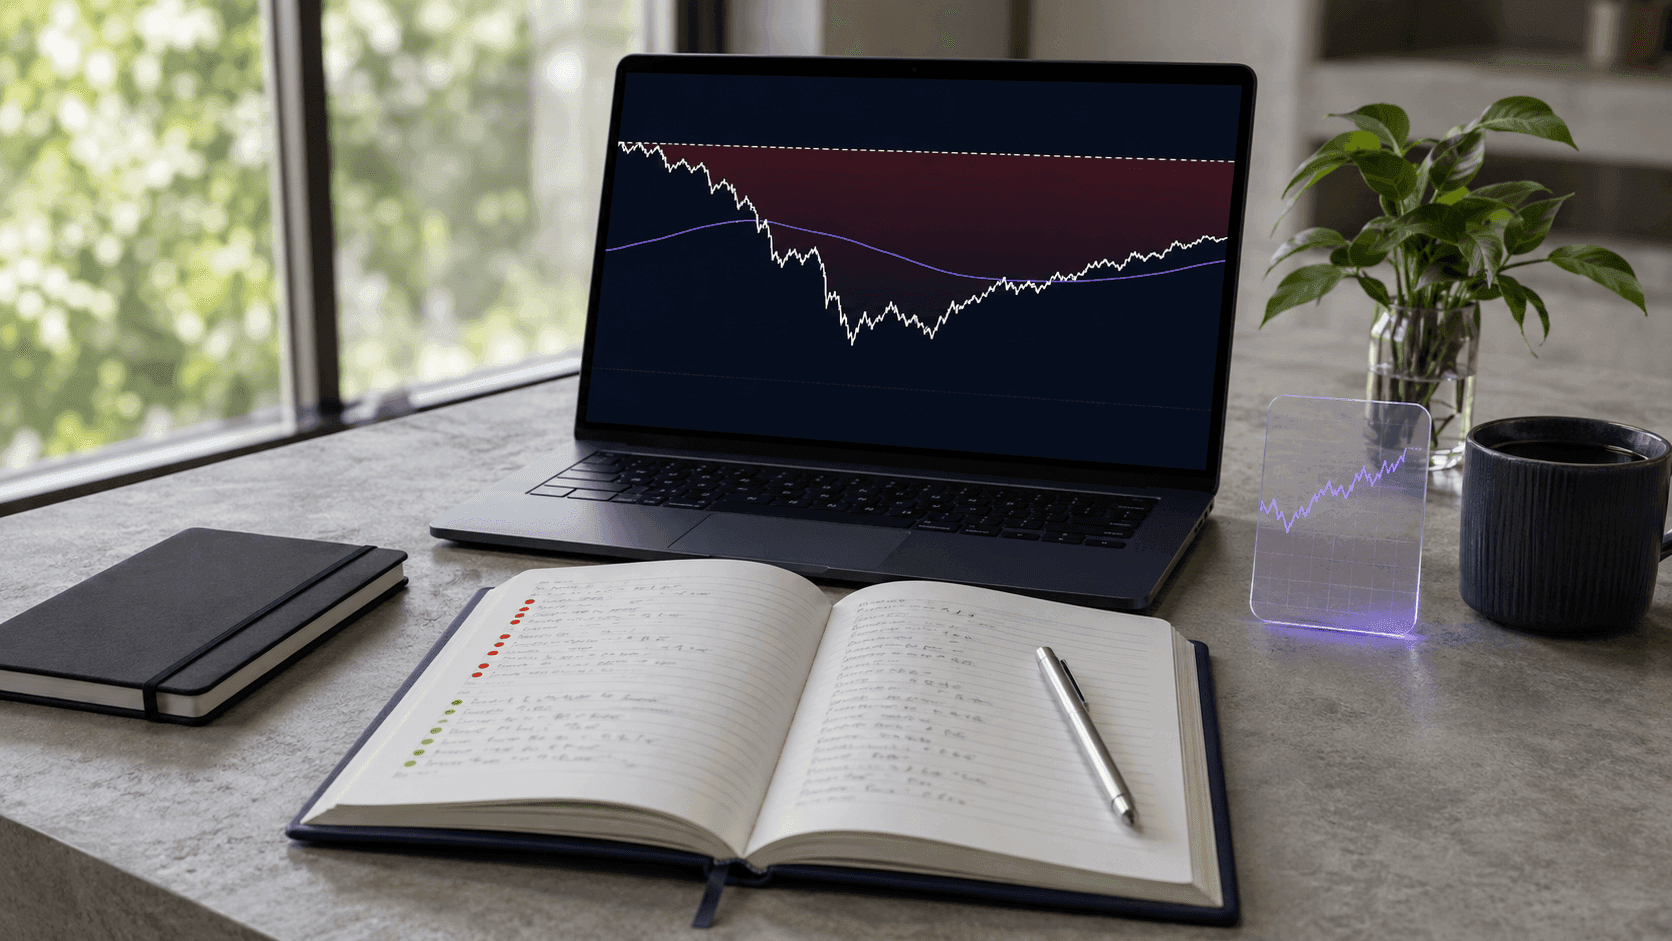
Every trader in a drawdown asks the same two questions, usually in the same week.
Is this normal? And: has my edge stopped working?
The first has a real answer, and it is more reassuring — and more uncomfortable — than most people expect. The second is much harder than it sounds, and the honest version of the answer is the most useful thing in this article.
So let us do what almost nobody does before the drawdown arrives: work out what a normal one actually looks like, in depth, in duration, and in how long you have to sit in it before it means anything.
Two numbersA drawdown is two numbers, and most people track one
A drawdown is the fall from an equity high to the lowest point before a new high. It has a depth — how far below the peak you went — and a duration — how long you spent under water before getting back.
Almost every trader can tell you their worst depth. Almost nobody can tell you their longest duration, and duration is the one that ends careers. Nobody quits at minus 12%. People quit after four months of not making progress.
Both numbers are predictable, and neither of them is mostly about the market.
DepthThe depth is your decision, not the market's
Here is a strategy with a real but modest edge: it wins 45% of the time and its winners are 1.5 times its losers. That is an expectancy of +0.125R per trade — profitable, unspectacular, and roughly what a working discretionary system looks like. Now run it 200 trades at different risk levels and record the worst drawdown along the way.
| Risk per trade | Typical worst drawdown | 1 run in 10 | 1 run in 100 |
|---|---|---|---|
| 5% | 49.2% | 68.1% | 82.1% |
| 3% | 32.2% | 48.1% | 62.5% |
| 2% | 22.5% | 34.6% | 47.2% |
| 1% | 11.7% | 18.7% | 26.7% |
| 0.5% | 5.9% | 9.7% | 14.3% |
Read up that first column. The strategy never changed. The win rate never changed. The market never changed. The only thing that changed was the size of the bet, and drawdown depth followed it almost exactly.
This is the single most important thing to understand about drawdowns: you choose the depth in advance, when you pick the risk per trade, and the market only chooses when it happens. If a 30% drawdown would end you emotionally or financially, then 3% risk is not a preference you can have. The quickest route to that drawdown is sizing up to win a loss back — see what revenge trading does to a winning strategy. An evaluation can be tighter still: the Topstep Trading Combine rules show how a strategy can remain inside its historical drawdown yet cross a trailing firm limit. The mechanics of that limit — and why a good week can leave you with less room than you started with — are in prop firm drawdown explained. The position sizing guide covers how to set risk and the five ways it quietly slips.
Losing streaksLosing streaks are arithmetic, not bad luck
The reason drawdowns feel like something has gone wrong is that long losing streaks feel impossible while you are in one. They are not. Over 200 trades, here is the longest run of consecutive losses you should expect purely from chance:
| Win rate | Typical longest streak | 1 run in 10 | 1 run in 100 |
|---|---|---|---|
| 35% | 10 | 14 | 20 |
| 40% | 9 | 12 | 17 |
| 45% | 8 | 11 | 15 |
| 50% | 7 | 9 | 13 |
| 60% | 5 | 7 | 10 |
At a 45% win rate — a perfectly good number for a system with 1.5R winners — eight losses in a row is the median outcome, not the disaster case. Eleven happens in one run out of ten. Fifteen happens in one out of a hundred, which means it will happen to you eventually if you trade for long enough. What that streak costs depends on your size — our guide to risk of ruin puts a probability on it for each risk level.
If you did not know that, the eighth loss feels like proof that something broke. It is not evidence of anything at all.
Recovery mathThe hole is deeper than it looks
Losses and gains are not symmetrical, because you make the gain on a smaller account than you lost it on:
| Drawdown | Gain needed to get back | Trades it takes, at this strategy's rate |
|---|---|---|
| 5% | 5.3% | 44 |
| 10% | 11.1% | 90 |
| 15% | 17.6% | 139 |
| 20% | 25.0% | 190 |
| 30% | 42.9% | 304 |
| 40% | 66.7% | 436 |
| 50% | 100.0% | 591 |
The third column is the one that should stop you. Our strategy compounds at about 0.12% per trade, so recovering a 20% hole takes roughly 190 trades — as long as the entire sample this article simulates. A 50% drawdown takes about 590, which at five trades a week is more than two years of doing everything right just to be level again.
The first two rows look harmless and the gap opens after about 20%. This is why "I will make it back" is a plan that works at 10% and quietly stops being a plan at 40% — and why the risk-per-trade table above matters more than any entry rule.
DurationDuration is what actually breaks people
Now the number nobody prepares for. Same strategy, same +0.125R edge, 1% risk, 200 trades. Not "how bad did it get" but how long did it stay bad:
| Metric | Trades spent under water |
|---|---|
| Typical longest stretch | 68 |
| 1 run in 10 | 144 |
| 1 run in 100 | 198 |
Sixty-eight trades is the median. If you take five trades a week, that is three months of watching a profitable strategy fail to make a new high. In one run out of ten it is 144 trades — most of a year. And 8.7% of these 200-trade runs finish below where they started, despite a genuinely positive edge running the whole time.
That is the part worth sitting with. A strategy that makes money can lose money for a year. Not because it broke. Because 200 trades is a small sample and variance is bigger than most people's patience.
Edge or noiseSo has the edge stopped working?
This is the question you actually want answered, so here is the uncomfortable arithmetic first.
Suppose your true win rate is 45%. After a run of trades, what does your measured win rate look like?
| Trades measured | 90% of the time it reads between |
|---|---|
| 20 | 25% and 65% |
| 30 | 30% and 60% |
| 50 | 34% and 56% |
| 100 | 37% and 53% |
| 200 | 39% and 51% |
| 500 | 41% and 49% |
After twenty trades, an unchanged 45% strategy will show you anything from 25% to 65%. So "my win rate has collapsed to 30%" after a bad month is not a finding. It is the width of the measurement.
It gets worse when you try to separate a real edge from a dead one by results. Take 40-trade windows — a couple of months for most people — and count how many finish in the red:
| Strategy | 40-trade windows that lose money |
|---|---|
| Real edge (+0.125R) | 31.9% |
| Zero edge | 56.5% |
| Negative edge | 80.1% |
A working strategy loses money in roughly one of every three two-month windows. A dead one does it in a bit more than half. Those distributions overlap heavily, which means a losing quarter is close to worthless as evidence either way. You cannot answer "is my edge gone" from the P&L in any timeframe short enough to be useful.
What you can actually check
Since the equity curve will not tell you, check the things that change before the curve does — all of which live in your trade records, not in your account balance:
- Did the market you trade change? A volatility regime shift, a spread widening, a venue change, a rule change. This is a fact you can look up, not a feeling.
- Are you still taking the same trades? Compare the setups in your recent losers against the ones in your rules. Drawdowns quietly widen the filter — the entry that would not have qualified in March qualifies in September because you need a win.
- Is your average loss bigger than your planned loss? This is the most common real cause. The edge did not die; the stops moved. Planned risk versus realised risk per trade is a two-column check.
- Has your holding time drifted? Cutting winners faster and letting losers run longer is the standard drawdown reflex, and it silently converts a 1.5R system into a 0.8R one.
- Are you trading more? Frequency almost always rises in a drawdown. More trades in the same market usually means worse trades.
Four of those five are recorded automatically if you keep a journal, and none of them are visible in the equity curve. Notice what they have in common: they are all questions about your behaviour, and the drawdown is what changes it. That is the sense in which drawdowns really do break strategies — not through the market, but through the person operating it. The expectancy math shows why a small drift in average R matters more than a change in win rate.
What helpsWhat actually helps while you are in one
The one mechanical rule with a measurable payoff is cutting risk while under water. Same strategy, but halve the risk per trade whenever the account is more than 8% below its peak, and restore it at a new high:
| Metric | No rule | Halve risk below −8% |
|---|---|---|
| Typical return over 200 trades | 26.4% | 21.7% |
| Typical worst drawdown | 11.7% | 10.8% |
| Worst drawdown, 1 run in 100 | 26.6% | 18.8% |
The rule costs about five points of median return and cuts the tail — the one-in-a-hundred disaster — by almost a third. That is the whole trade, stated honestly: you are buying a shallower worst case with some of your expected return. Whether it is worth it depends on whether the deep case would make you stop trading, because a strategy you abandon returns zero.
Two things that do not help, both of which the numbers above explain:
- Sizing up to recover faster. It works in the median and destroys you in the tail — that is exactly what the depth table shows. Doubling risk to climb out of a hole doubles the depth of the next hole.
- Changing the strategy after a losing month. You have seen that a 40-trade window says almost nothing. Switching systems after each bad window means you are always sampling the beginning of a new system's variance and never collecting the edge of any of them.
Your numbersAnswer it with your own numbers
Everything above uses one made-up strategy. The point is not the specific figures — it is the method, and the method needs your win rate, your average R, and your risk per trade to say anything about your account.
That is a journal's real job. Not therapy and not a diary: a record long enough to make the table above about you. Log entry, stop, size, planned risk and outcome on every trade, and after a hundred of them you can say which of the rows you belong on. The Trading Journal reports win rate, average R, realised versus planned risk and your actual drawdown; the Risk / Reward Calculator is where you set the risk before the trade exists. If you are still deciding what to log, start with how to keep a trading journal, and if the problem is that setups get taken which should not have been, the chart-to-journal workflow is the gate that stops it.
MethodologyWhere these numbers come from
Every figure in this article is computed, not quoted. The simulation runs 60,000 sequences of 200 trades. Each trade risks a fixed percentage of the current account and a winner returns that risk multiplied by the reward-to-risk ratio, which is how fixed-fractional sizing actually compounds. The recovery percentages are plain arithmetic, and the trades-to-recover column comes from the strategy's expected log growth per trade — 0.00117, which reproduces the simulated 26.4% median over 200 trades to the decimal.
Three assumptions are worth stating because they all push the same way:
- Trades are independent. Real trades are not — correlated positions and clustered market conditions make streaks longer and drawdowns deeper than this model shows.
- The win rate and reward-to-risk are constant. A real edge drifts. That also widens the outcomes.
- No commissions, financing or slippage. Adding them lowers every return above and deepens every drawdown.
So treat these as the optimistic case. A real account should expect the same shapes, slightly worse.
FAQFrequently asked questions
What is a normal drawdown for a retail trader? There is no universal number, because depth is set by your risk per trade rather than by your skill. For a modest edge at 1% risk, a worst drawdown near 12% over 200 trades is typical and about 19% happens in one run out of ten. At 3% risk the same strategy typically draws down about 32%. Pick the risk first and the drawdown follows.
How long should a drawdown last? Longer than feels reasonable. For the strategy simulated here, the median longest stretch under water was 68 trades and one run in ten spent 144 trades below its previous high — with a positive edge running the whole time.
How many losing trades in a row is too many? Consecutive losses are a poor alarm. At a 45% win rate, eight in a row is the median over 200 trades and fifteen happens in one run out of a hundred. A streak tells you about your win rate, not about your edge; what should trigger a review is a rule broken, not a loss taken. Two strategies with the same profit factor can have typical worst streaks of 4 and 12 losses — the edge and the ride are separate numbers.
Should I stop trading during a drawdown? Stopping entirely means you cannot recover and cannot learn. Halving risk below a set drawdown level is the version with numbers behind it: in this simulation it cut the one-in-a-hundred drawdown from 26.6% to 18.8% for about five points of median return. Stop completely only when the review above finds a broken process, not a losing month.
Can I tell whether my strategy still works from my results? Not over a few months. A working strategy loses money in about a third of its 40-trade windows and a dead one in a bit more than half, so a single losing window barely moves the answer. Judge the process — same setups, planned risk equal to realised risk, unchanged holding times — and let the sample grow.
Next stepBefore your next trade
Open your journal and find two numbers: your worst drawdown so far and the longest stretch you have spent below a previous high. Then find the row in the depth table that matches your risk per trade. If your worst drawdown is far past the one-in-a-hundred column for the risk you think you are taking, you are not taking that risk — and that is a sizing problem you can fix this week, not an edge problem.