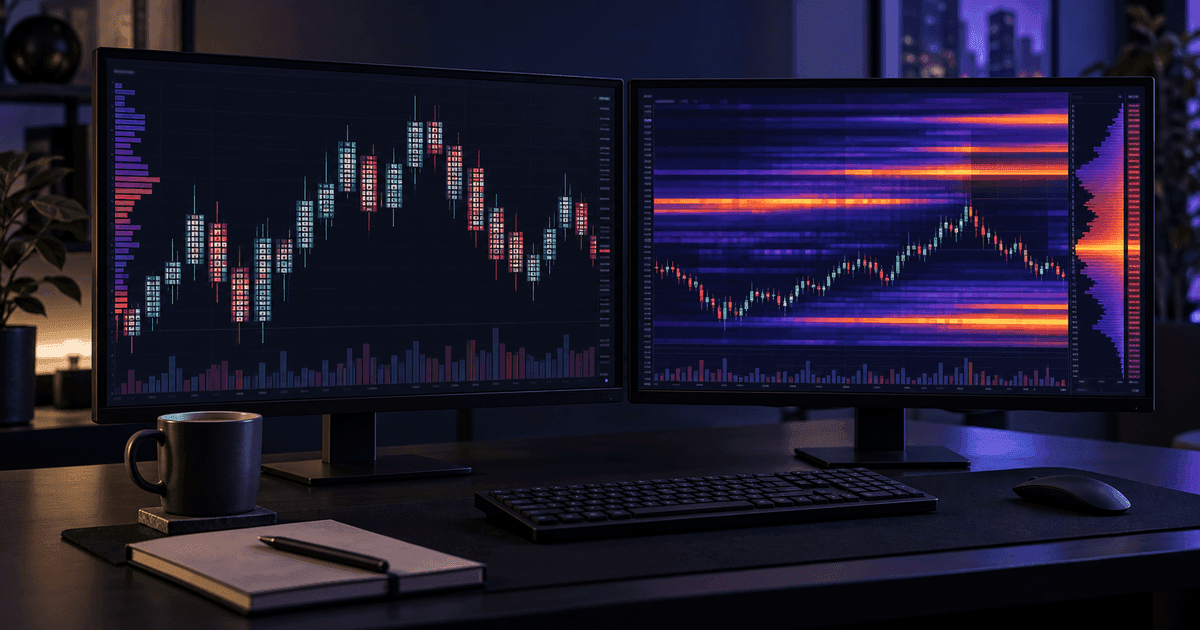
NinjaTrader already knows the entry, exit, quantity, commission and the best and worst prices reached while a trade was open. Its Trade Performance window can show Summary, Analysis, Executions, Trades, Orders and a built-in Journal. That sounds like a complete trading journal. It is not—not until the platform’s execution record is joined to the plan, setup and behavior that produced it.
The useful workflow has two layers. NinjaTrader is the source of truth for fills and platform statistics; your journal is the source of truth for intent and repeatability. After every futures session, reconcile the first and write only the fields in the second that can change tomorrow’s decision.
This guide shows which NinjaTrader metrics deserve attention, which numbers can mislead, and a ten-minute review that catches overtrading, poor exits and rule breaks before another session begins.
Two recordsWhat NinjaTrader knows—and what it cannot know
From the Control Center, NinjaTrader’s official workflow is New → Trade Performance. The Trades display pairs completed buy/sell or sell/buy executions; the Journal display accepts dated notes, and an execution or trade can be right-clicked to create a journal entry attached to it.
What happened
Execution prices and times, quantity, long or short, commission, profit, cumulative profit, MAE, MFE, end-trade drawdown and the order history.
Why it happened
Setup, planned entry/stop/target, planned risk in R and dollars, market context, screenshot, rule adherence, emotion and the lesson that changes the next session.
The built-in Journal is useful because it sits next to the actual execution. Its limitation is the same as every free-text box: it cannot enforce a vocabulary. “Bad trade, entered early” is not a field you can filter next month. “Setup: opening range; violation: entry before confirmation; planned risk: 1R” is.
Our broader guide to keeping a trading journal explains the minimum fields and weekly review. NinjaTrader supplies many of those automatically; your job is to add structure rather than duplicate the broker record.
Reconcile firstMake sure the report is complete
Before interpreting a metric, verify that the underlying executions are present.
NinjaTrader’s help guide warns that some brokers do not provide every historical execution. A good-till-cancelled order could fill while the platform is disconnected, leaving the local performance database incomplete; NinjaTrader lets the user add a missing historical execution manually. The platform also notes that a position already open at the beginning of the selected date range can pull earlier trades into the report until that position becomes flat.
Set the exact session window
Use the same session template and time zone every day. Futures sessions cross midnight, so a calendar date and a trading session are not always the same record.
Match executions before trades
Confirm every fill against the broker statement or Control Center Executions tab. One missing partial fill changes the paired trade and every statistic after it.
Include commissions
NinjaTrader sums commissions only when the account has the correct commission template. A gross-positive scalping session can be net-negative when the template is missing.
Inspect scaled entries and exits
NinjaTrader says scaled-in or scaled-out positions are treated as separate trades. Decide whether your journal should preserve those legs or group them as one idea.
Separate accounts and strategies
When several NinjaScript strategies trade the same account, NinjaTrader’s pairing is based on the overall account position and can differ from a strategy-specific result.
The same reconciliation principle applies in other platforms. Our MetaTrader 5 journal workflow starts with positions, orders and deals because an attractive dashboard built on incorrectly paired fills is still wrong.
Six metricsWhat to track after every futures session
Net P&L after commission
- Question it answers
- Did the session actually make money?
- Journal beside it
- Planned daily stop; stopped on time?
Profit factor
- Question it answers
- How much gross profit per $1 of gross loss?
- Journal beside it
- Setup tag and sample size
Average trade / expectancy
- Question it answers
- What did one trade add on average?
- Journal beside it
- Result in R, not only dollars
MAE
- Question it answers
- How far did trades move against the entry?
- Journal beside it
- Initial stop and entry quality
MFE and ETD
- Question it answers
- How much favorable move was given back?
- Journal beside it
- Exit reason and management rule
Trades per day
- Question it answers
- Did activity expand after the planned window?
- Journal beside it
- A/B/C trade grade and rule violation
| Metric | Question it answers | Journal beside it |
|---|---|---|
| Net P&L after commission | Did the session actually make money? | Planned daily stop; stopped on time? |
| Profit factor | How much gross profit per $1 of gross loss? | Setup tag and sample size |
| Average trade / expectancy | What did one trade add on average? | Result in R, not only dollars |
| MAE | How far did trades move against the entry? | Initial stop and entry quality |
| MFE and ETD | How much favorable move was given back? | Exit reason and management rule |
| Trades per day | Did activity expand after the planned window? | A/B/C trade grade and rule violation |
Source: CalculatorAI · calculatorai.app · NinjaTrader 8 Statistics Definitions · CalculatorAI review framework
Net P&L after commission
Start with what remains, not the green gross-profit line. A futures strategy with a small average trade is especially sensitive to exchange, clearing and commission costs. Do not manually subtract an advertised commission again if the NinjaTrader report already includes a configured template; reconcile the net to the broker statement instead.
Profit factor and expectancy
Profit factor is gross profit divided by the absolute value of gross loss. Expectancy is net result divided by trades when measured in dollars, or (win rate × average win) − (loss rate × average loss) in consistent units. Neither is trustworthy after five trades. Their job is to compare a sufficiently repeated setup, not to grade one morning.
Our expectancy guide shows why win rate alone can reward the wrong behavior. A 70% win rate can lose money if the average loss is several times the average win.
MAE, MFE and end-trade drawdown
NinjaTrader defines maximum adverse excursion (MAE) as the worst price reached relative to entry and maximum favorable excursion (MFE) as the best. End-trade drawdown (ETD) is MFE minus the final profit: the favorable movement surrendered before exit.
These metrics need context. NinjaTrader says real-time MAE/MFE can include bid/ask prices that are not visible on a chart; periods without real-time price updates cannot contribute unseen highs and lows. In a backtest, bar highs and lows are used instead. Do not compare the two datasets as if their path measurement were identical.
Worked sessionHow eight extra trades erased the morning
Consider a synthetic session measured in R, where 1R is the planned loss if the original stop is hit. The first four trades produce +2R, −1R, +1.2R, −1R. The trader has completed the planned window at +1.2R. Instead of stopping, eight more trades add +1R, −0.5R, −0.5R, +0.8R, −0.5R, −0.5R, −0.5R, −0.5R.
Stopped as planned
- Trades
- 4
- Win rate
- 50.0%
- Profit factor
- 1.60
- Net
- +1.20R
- Expectancy
- +0.300R
After eight extra trades
- Trades
- 12
- Win rate
- 33.3%
- Profit factor
- 1.00
- Net
- 0.00R
- Expectancy
- 0.000R
| Review point | Trades | Win rate | Profit factor | Net | Expectancy |
|---|---|---|---|---|---|
| Stopped as planned | 4 | 50.0% | 1.60 | +1.20R | +0.300R |
| After eight extra trades | 12 | 33.3% | 1.00 | 0.00R | 0.000R |
Source: CalculatorAI · calculatorai.app · drafts/ninjatrader-journal-numbers.mjs
The journal insight is not “trade fewer” in the abstract. It is: after the planned window, unplanned trades contributed −1.2R and converted a 1.60 profit factor into 1.00. Tag after-window or revenge/continuation on those trades. After twenty sessions, compare that tag with planned trades. The behavior becomes an editable rule instead of a feeling.
Exit qualityMFE is not a fantasy target
In another synthetic four-trade sample, average MFE is 1.38R, the average final result is 0.53R and average ETD is therefore 0.85R. It is tempting to say the trader “left 0.85R on the table.” That is not a valid target: MFE is known only after the path is complete, and no rule can exit every trade at its best tick.
Use MFE to test an exit rule, not to imagine perfect exits
A high give-back number asks whether one repeatable exit rule would capture more—not whether the trader should have sold every high.
Test a concrete alternative—time exit, trailing stop, first target plus runner—on a group of similarly tagged trades. If it improves average result without unacceptable drawdown or a tiny sample, then change the plan. One painful give-back is not evidence.
Ten-minute routineWhat to do after the close
Reconcile fills and costs
Trade count, quantities, entry/exit pairing and commissions must match the broker record before any analysis begins.
Copy only decision fields
Setup, planned R, actual R, screenshot, entry/exit reason and rule adherence. Do not retype timestamps and prices the platform already owns.
Tag the session
Instrument, session, setup, long/short, A/B/C quality, planned or unplanned, and one behavior tag. Use the same vocabulary every day.
Read the six metrics
Net after costs, profit factor, expectancy, MAE, MFE/ETD and trade count. Compare with the same setup and session, not the whole account indiscriminately.
Write one change for tomorrow
A specific, observable action: no entry before the opening range closes; stop after the planned window; bracket order entered before fill. One change is review; ten are guilt.
The Trading Journal turns those tags into comparable groups and keeps chart screenshots beside the fill record. If you are rehearsing in simulation first, the TradingView paper-trading workflow explains why a separate paper account and no-reset rule are necessary before live results mean anything.
Where these numbers come from
The Trade Performance navigation, Journal behavior, execution/trade pairing, available analysis periods and field definitions come from NinjaTrader’s official Using Trade Performance, Performance Displays and Statistics Definitions pages, checked September 23, 2026.
Both worked examples are synthetic. drafts/ninjatrader-journal-numbers.mjs calculates win rate, gross profit/loss, net R, profit factor, expectancy and average MAE/MFE/ETD directly from the listed sequences. They exclude commissions and slippage, which biases the results upward; the article says so where the figures appear.
FAQFrequently asked questions
Does NinjaTrader have a built-in trading journal? Yes. Open New → Trade Performance and select Journal. You can add free-text entries directly or right-click an execution or trade and add a journal entry tied to it.
What is the difference between NinjaTrader’s Trades and Executions displays? Executions are individual fills. Trades are completed entry/exit pairs assembled from those fills. Scaled entries or exits may create separate trades, so check the pairing before relying on the statistics.
Which NinjaTrader metrics matter most for futures? Net P&L after commission, profit factor, average trade or expectancy, MAE, MFE, end-trade drawdown and trades per day. Always segment them by setup and session rather than reading only the all-account total.
Why does NinjaTrader show a different trade count from my journal? Partial fills, scaling, an open position crossing the report boundary, missing historical executions or multiple strategies in one account can change entry/exit pairing. Reconcile executions first and decide whether the journal groups legs into one trade idea.
Should I journal in dollars or R? Keep both. Dollars reconcile to the account; R divides the result by the planned risk and lets you compare trades taken with different contract sizes and stop distances.
Next stepTurn today’s session into one rule
Open NinjaTrader Trade Performance, reconcile the executions and record today’s six metrics. Then add the trades to the Trading Journal with setup, planned R and rule adherence. The useful output is not a verdict on the day. It is one measurable rule for the next one.